The Belfry Theatre is, in my view, the best producer of mainstream theatre in the province. They’re more consistent than The Arts Club or The Vancouver Playhouse, and yet they take more risks with the play choices.
Yesterday I got a media release from the Belfry, summarizing their AGM and reporting on their last year’s work. It reminded me that they’re also currently one of the most financially stable and successful theatres that I know of.
They have an huge subscriber base of 6700 people for a theatre that only seats 277. Their average attendance for their mainstage shows last season was a mind-boggling 92%. They recently extended their production runs from four to five weeks when many Canadian theatres are reducing theirs to three.
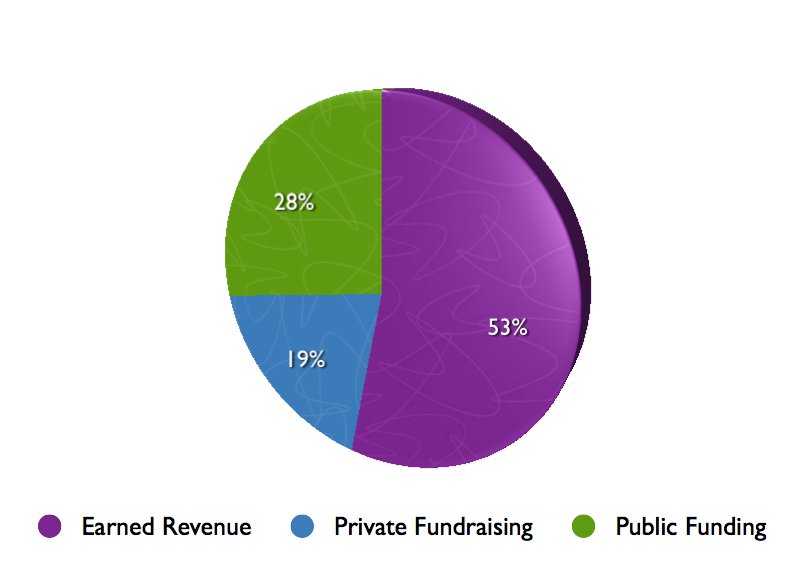
I’ve always been an keen observer of arts funding and economics, and so was interested to see where the Belfry got its money from. And, as regular readers know, I love a chart. I produced a couple. The first shows where the Belfry’s revenue comes from:
The second shows the blue chunk of the big pie–private fundraising:

I asked Mark Dusseault at the Belfry about why ‘gaming money’, funding from BC Lottery Corporation, is under ‘private fundraising’. He explained that there were various reasons: government accounting practice, no peer review process and the way the money used to be doled out.
When gaming was originally set up we (staff and volunteers from the theatre) had to go and work the events. We spent a couple of days a year either at a bingo parlour or casino. We were, in essence, fundraising. We had to apply to participate and there was no guarantee as to how much money we would make (or lose).
I actually remember doing this once at a casino for some Vancouver theatre company.
The green slice is public money from sundry agencies: Canada Council for the Arts, CRD Arts Development and BC Cultural Services are the biggest contributors. Their entire budget is about $2.3 this year.
Where Does the Money Go?
I suppose the other question is how is that money spent?

I don’t have any great insights into these numbers. I just wanted to explore them a little, and make pretty charts. Do you have any insights?

Darren, this is an interesting post on a local fixture. Like yourself, I like the charts, and I also found the gaming breakdown interesting, so thanks for that. The last play I saw at the Belfry was called “#14” (I believe) about a fictional bus route in Vancouver. Very entertaining and the venue is a pleasure to be in.
Whats up with the off center charts? I find them skewed with section on right looking bigger… or perhaps they just make me dizzy.
EJ: It’s another way to lie with statistics. Actually, I just think they’re prettier. If I was going to do any really official pie charts, I’d stick to two dimensions.
The last play I saw at the Belfry was “Proof” with Nicholas Campbell and Thea Gill, and it was great.
I agree with Davin (this time around) that the venue itself is definitely a factor in their success.
Those are frickin’ beautiful 3D pie charts. I can say that with a serious face, because I am a math teacher during the day.
As far as the numbers themselves, I am shocked and appalled at how HEALTHY the Belfry is, economically. They are a high standard against which all others should be measured. Would that we all (Canadian professional theatres) have such healthy revenue and expenditure percentages. Wow!
I was going to mention how skewed the charts were as well. Not only does the tilt increase the bias (towards the first and largest sector–surely no coincidence), but the convexity (bulge?) also favors the foreground sector.
What is interesting is the number of people who find them pretty vs skewed–and I’m surprised the math teacher chose the former.